01The problem — supervising the machine
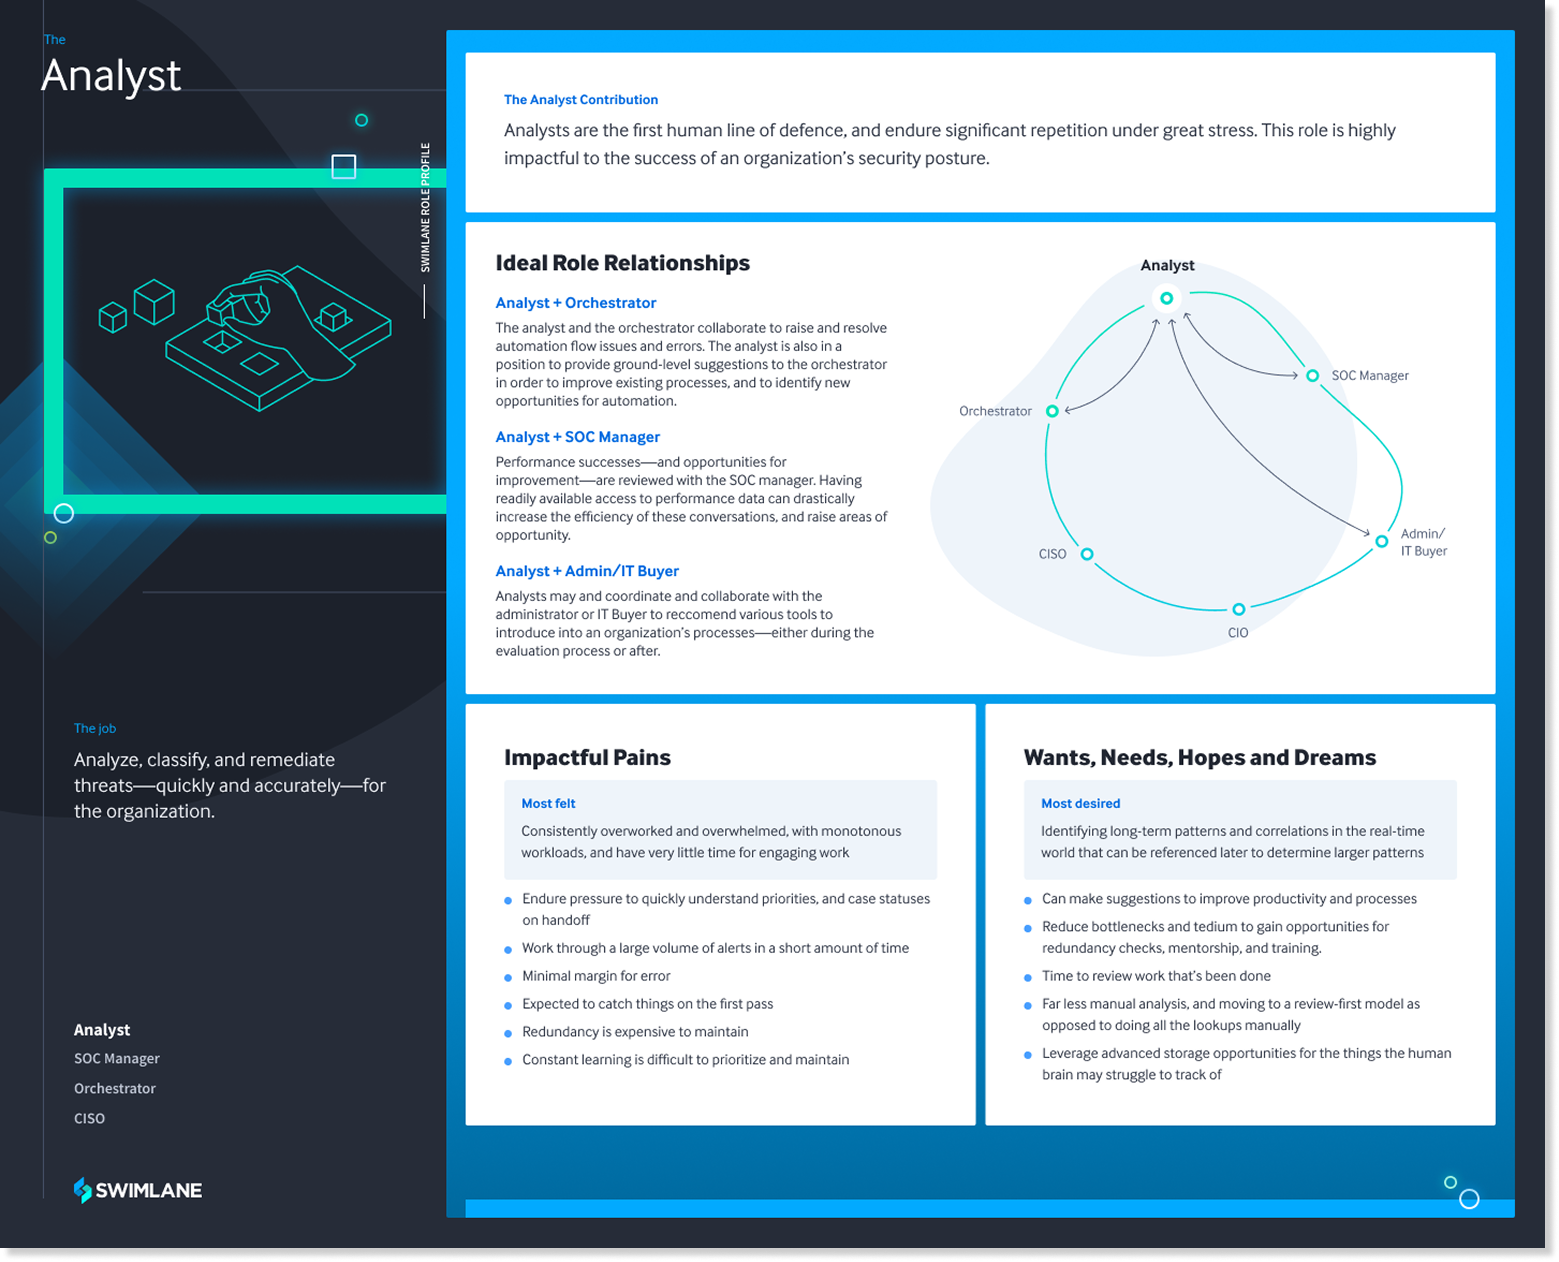
A security operations center runs on delegated action: thousands of alerts a day, 80–90% of response tasks automatable, and analysts who must decide — under time pressure, with careers and breaches on the line — which actions the machine takes alone and which wait for a human. Delegate too little and the team drowns. Delegate too much, blindly, and nobody can explain what the system did or why.
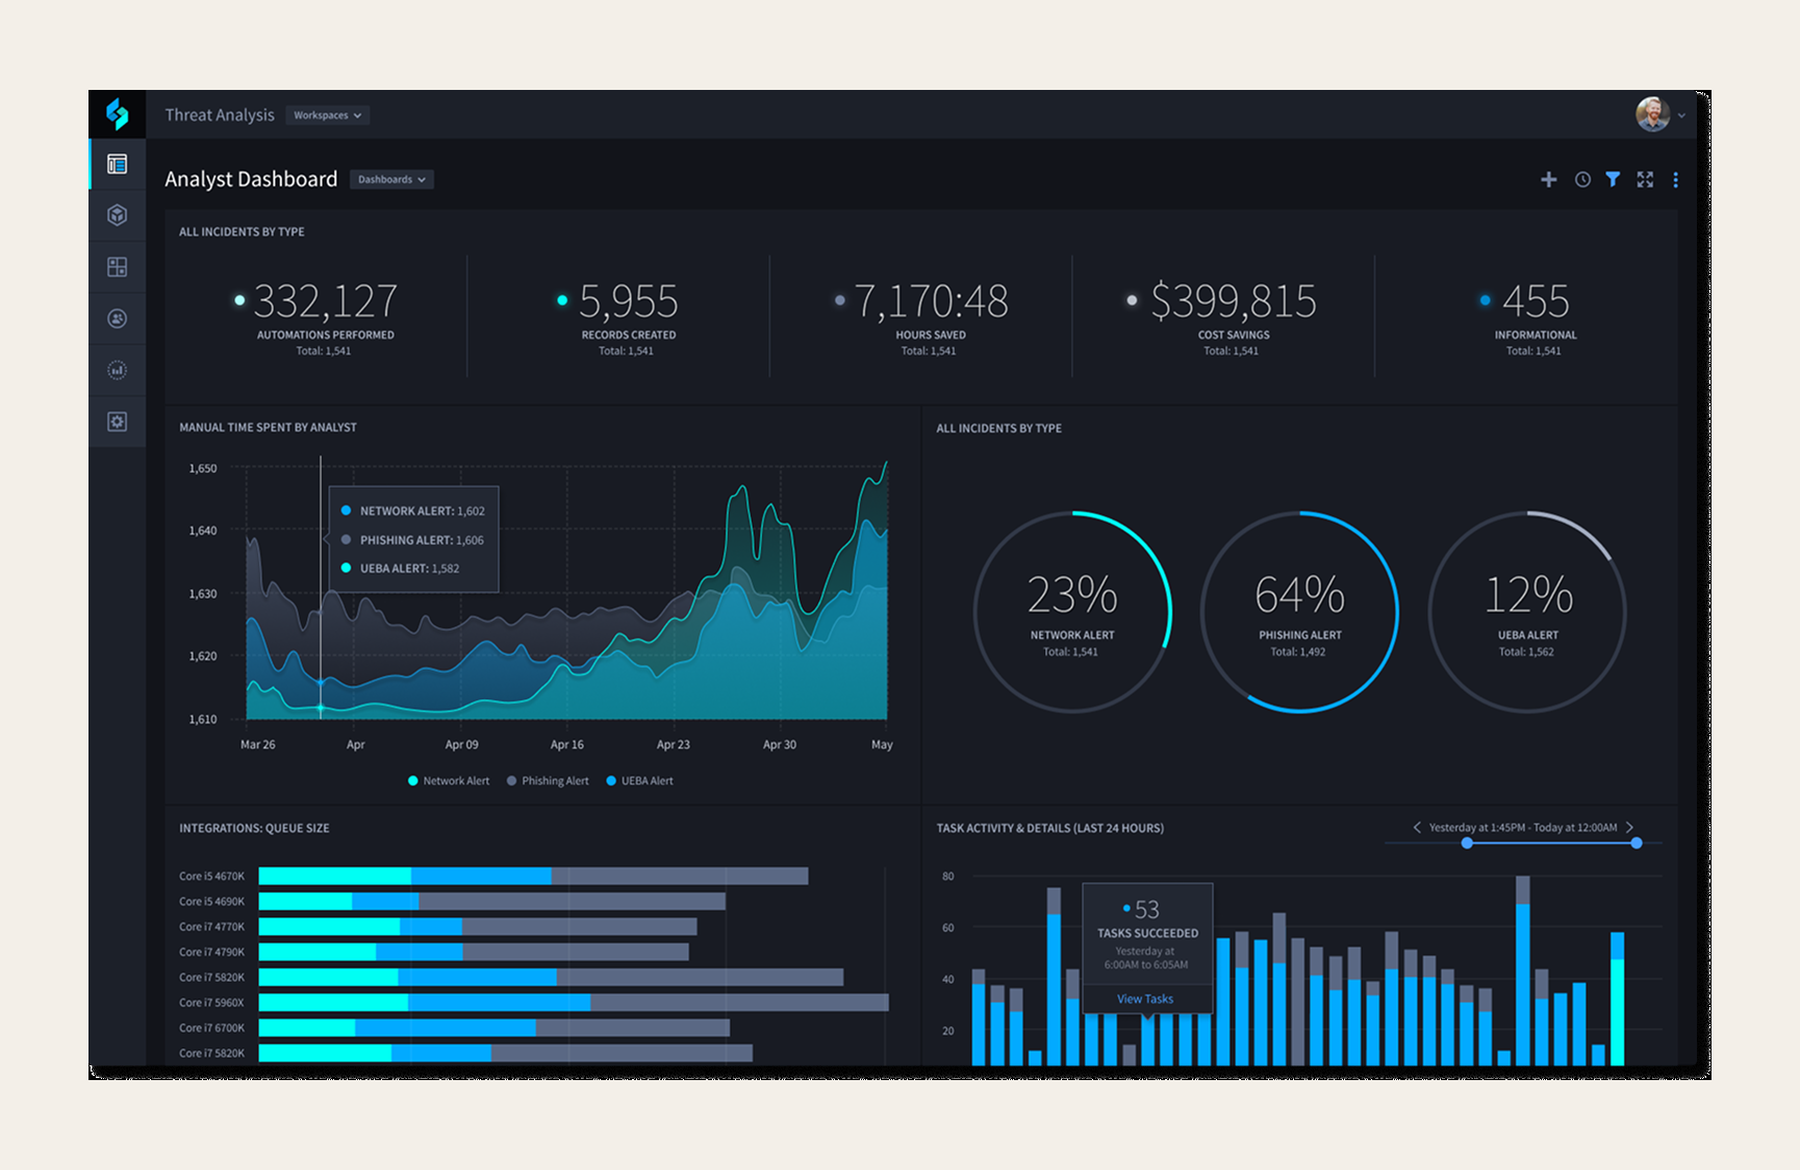
That is the agent-UX problem, a decade early. Every question 2026 teams are now asking about AI agents — how much autonomy, what must the system show, how does a human interrupt, what makes delegated action trustworthy — was the daily design work of SOAR. The dashboards were passive when I arrived: data display, not decision support. A pit stop, not a command center.
02The approach — embedded, not surveyed
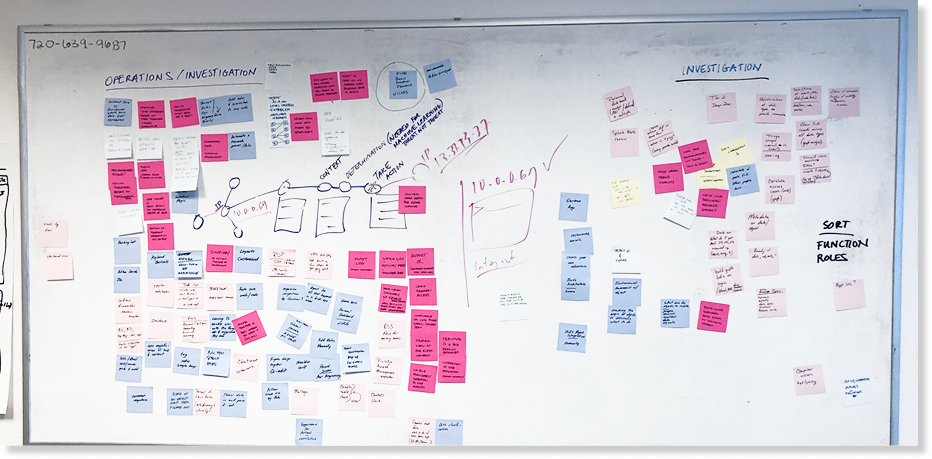
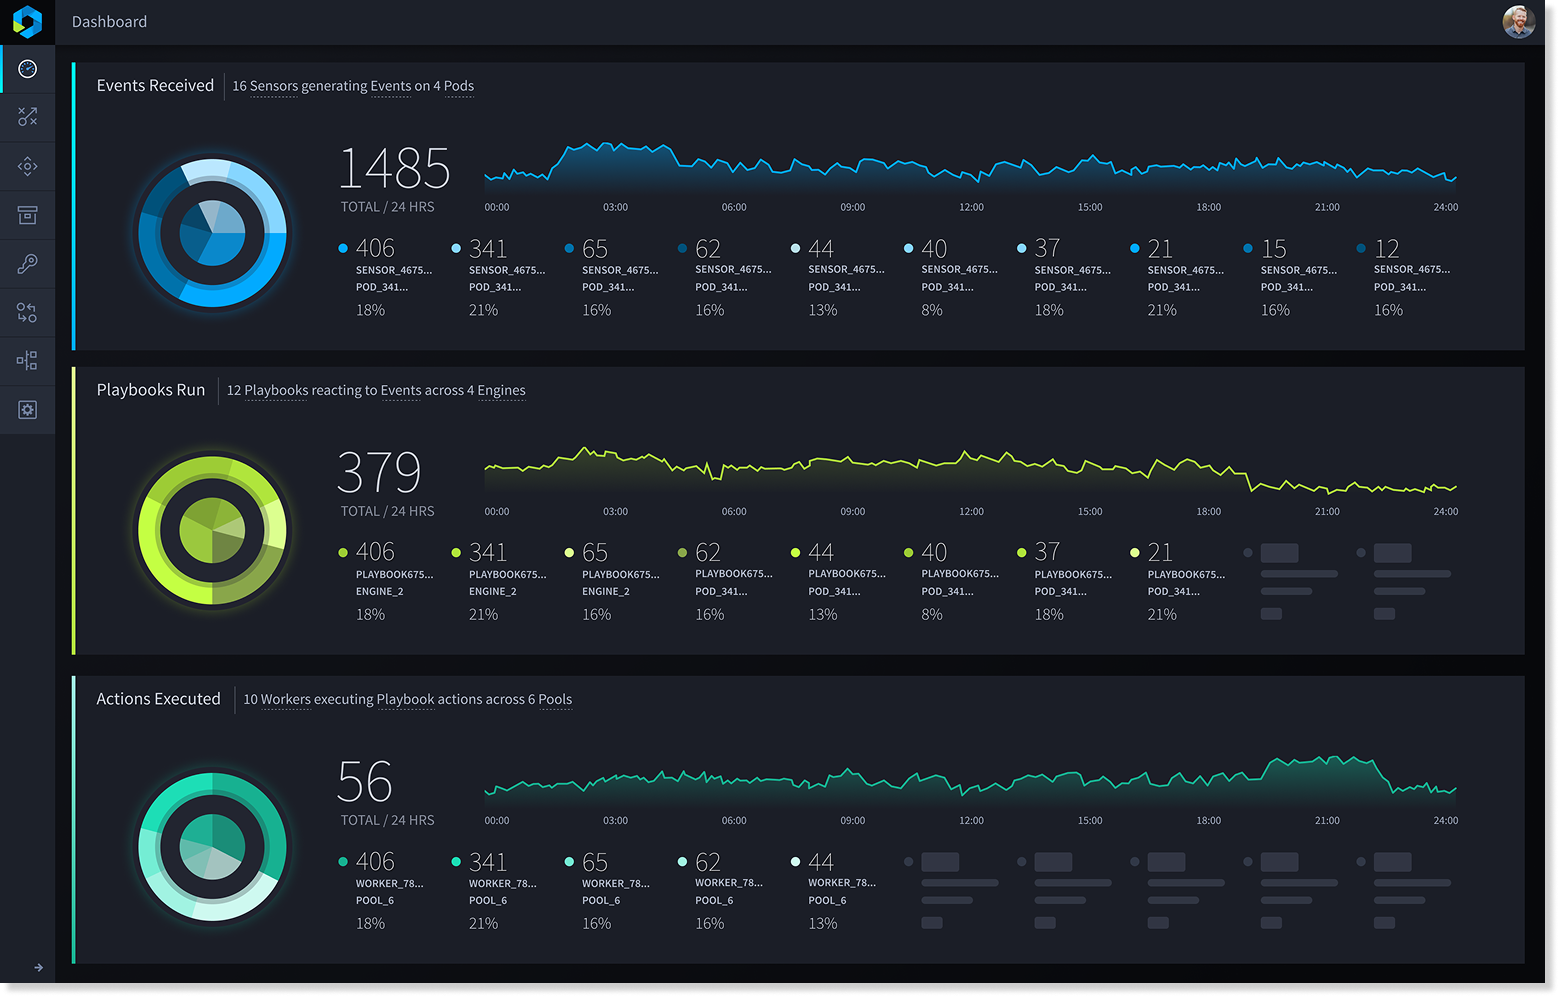
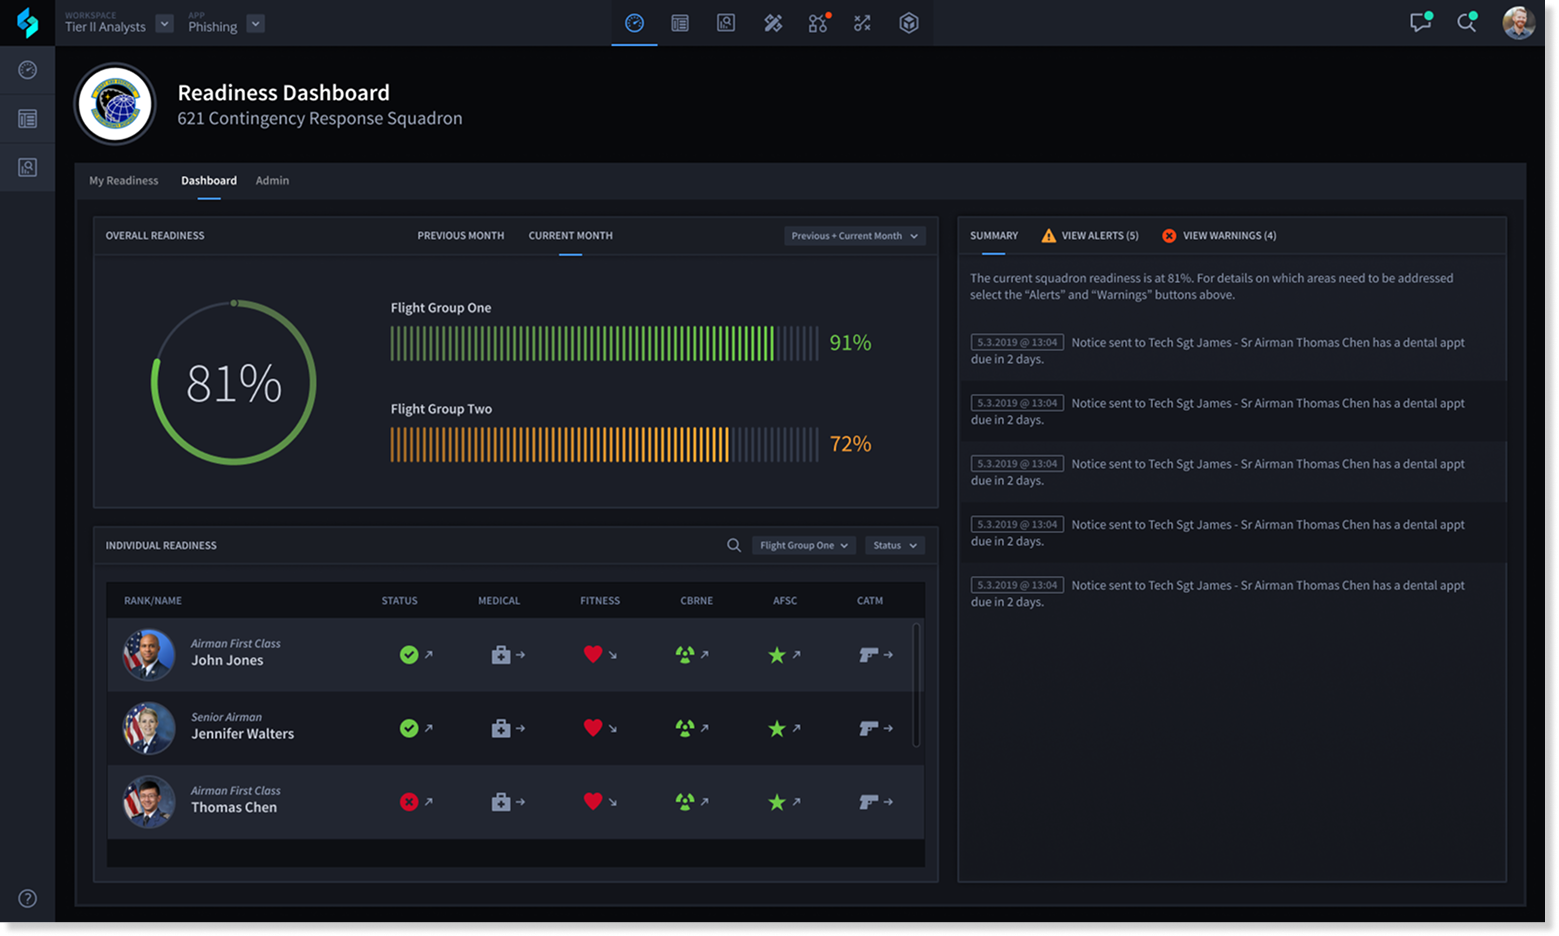
I spent weeks embedded with SOC teams at customer sites — shift changes, incident escalations, routine triage. The reframe that came out of it: dashboards aren't about showing data, they're about supporting decisions at three distinct altitudes, and the same screen has to serve all three without navigation:
- 30-second overview — is anything on fire?
- 2-minute triage — what needs a human now?
- Deep-dive analytics — what's trending, what should we automate next?
03Design decisions — the trust patterns
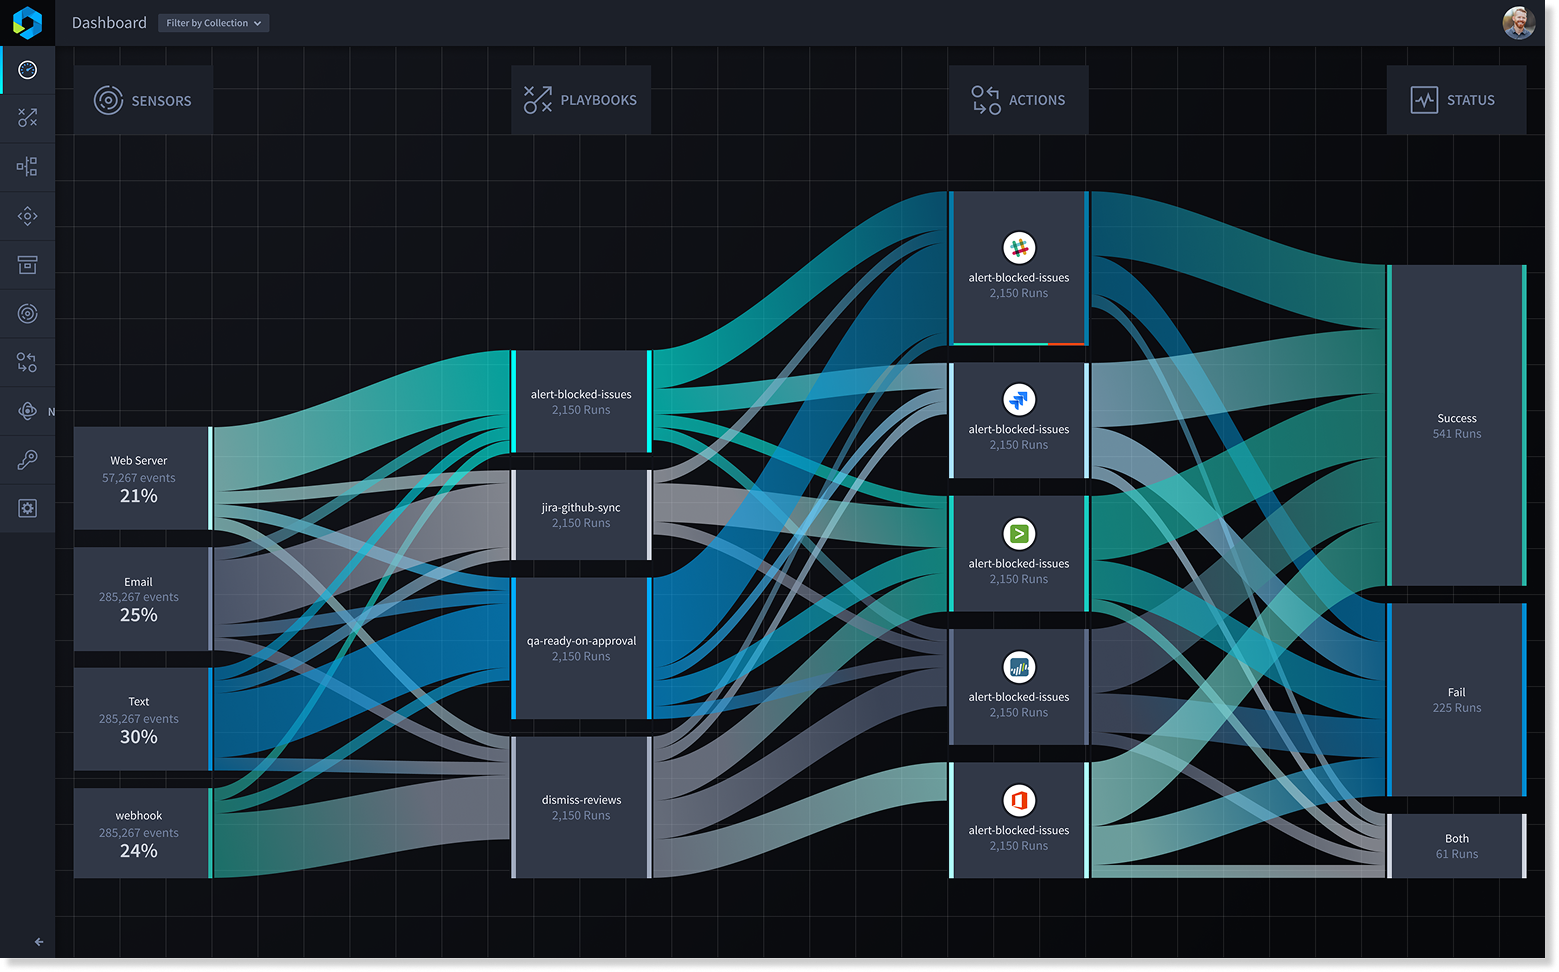
Every metric is a door
ShippedStatic reporting vs. drill-through everywhere
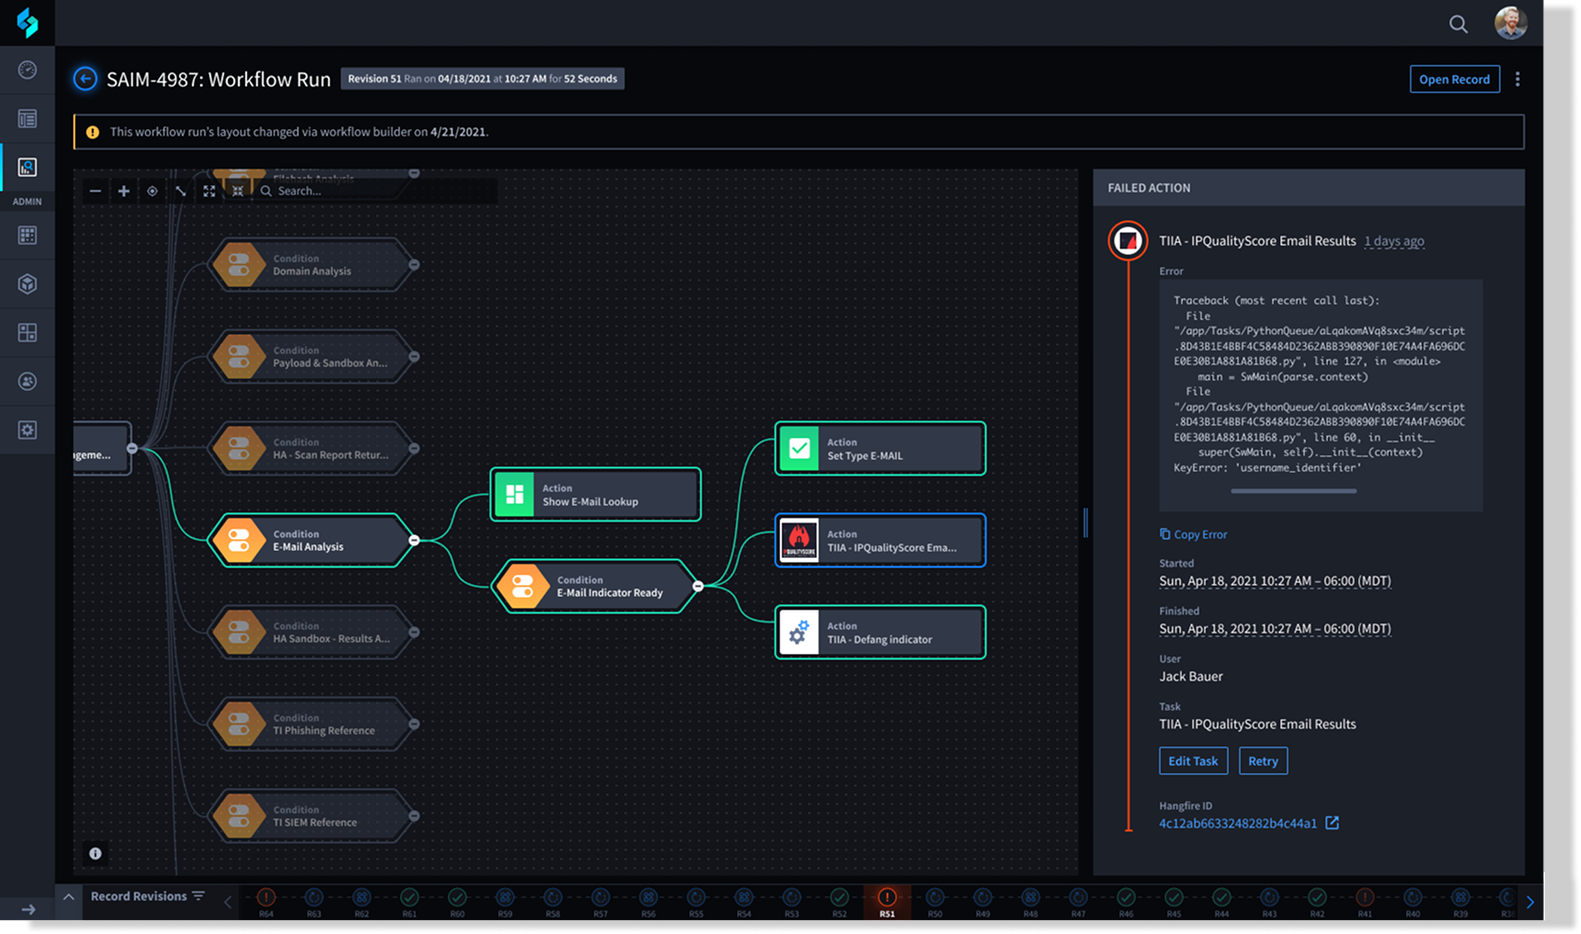
Every number on every dashboard clicks through to the cases and playbooks behind it. When the machine acts, the "why" is never more than one click away — machine action stays explainable, auditable, and correctable. Zero dead ends.
Impact: the pattern 2026 calls "explainable rationale" — shipped 2019. 3× dashboard engagement.
Autonomy as a dial, not a switch
ShippedFull auto vs. graduated delegation per playbook
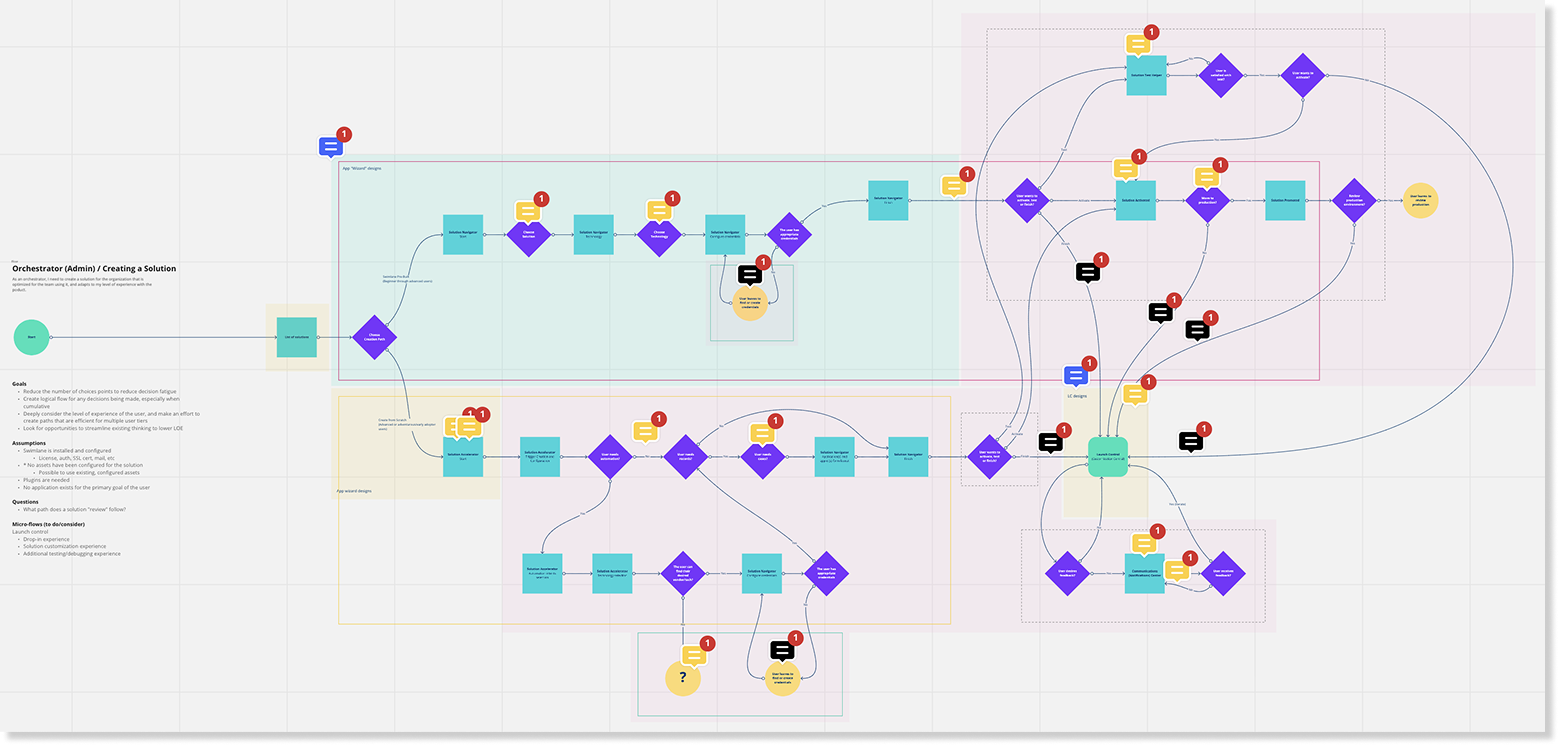
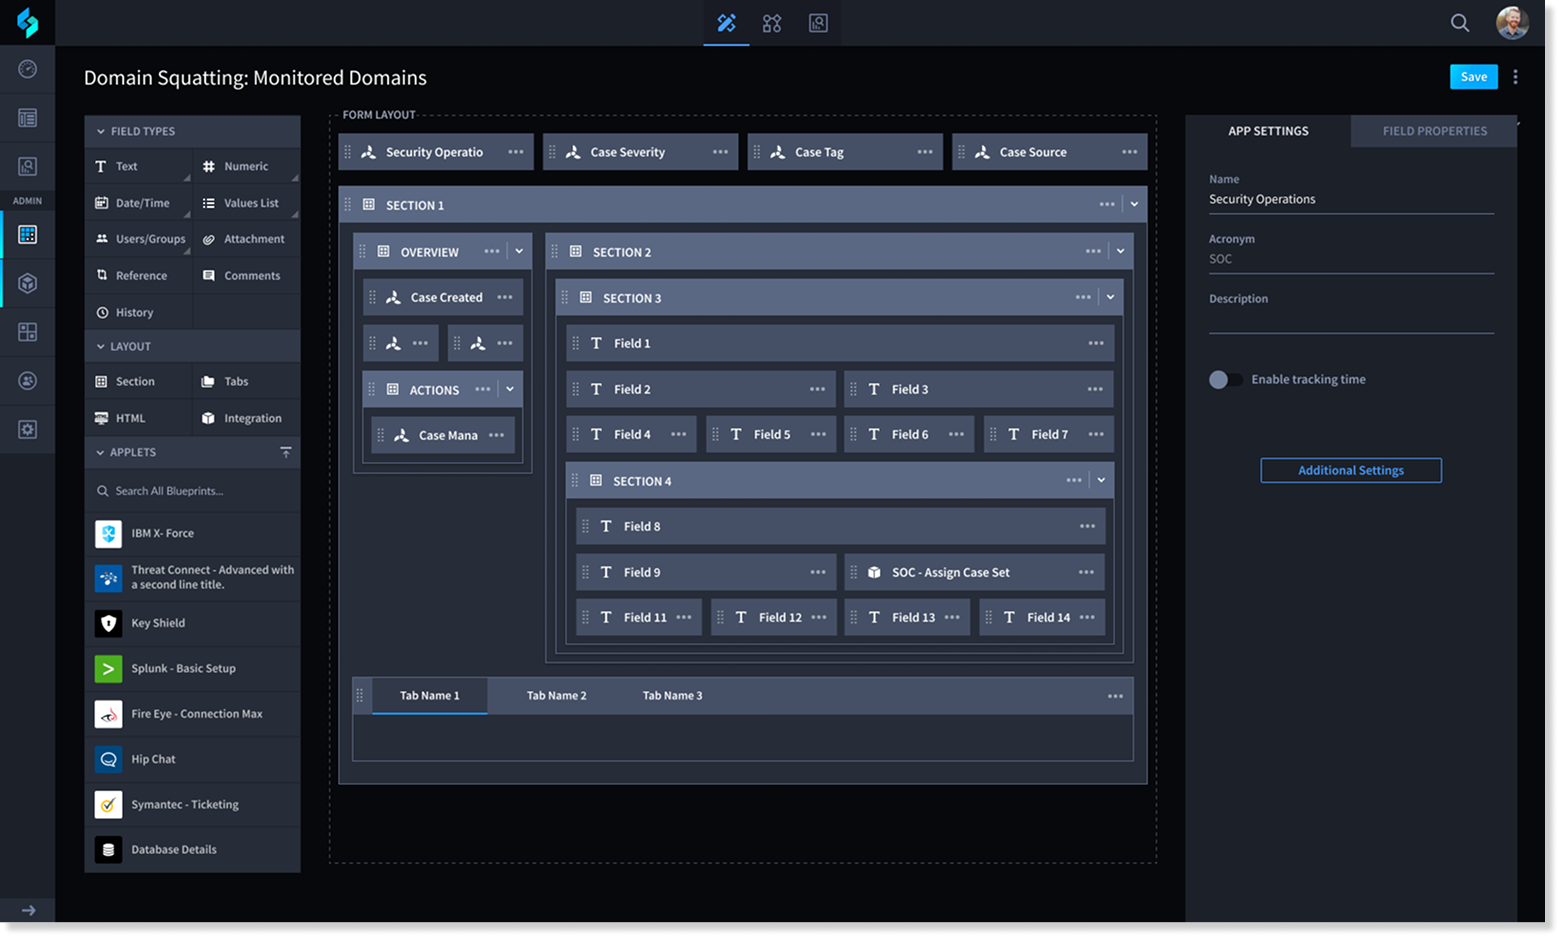
Playbook UX let teams set which steps run automatically and which pause for approval — per threat type, per severity. Human-in-the-loop wasn't a compliance checkbox; it was the product's core interaction.
Impact: teams tuned delegation to their own risk tolerance — adoption followed trust
Three-tier hierarchy from field observation
ShippedOne-dashboard-per-question vs. altitude layering
The 30-second / 2-minute / deep-dive model emerged from watching shift handoffs, not from stakeholder workshops. One surface, three reading depths.
Impact: 40% faster shift handoffs, 60% reduction in time-to-insight
Dark theme as a functional decision
ShippedBrand aesthetics vs. 12-hour-shift physiology
Analysts work dim rooms on long shifts; sustained attention is the scarce resource. Chart types chosen as cognitive tools — sparklines for trend, heatmaps for time patterns — not as decoration.
Impact: design cited as a top competitive differentiator in win/loss analysis
04The system that outlasted me
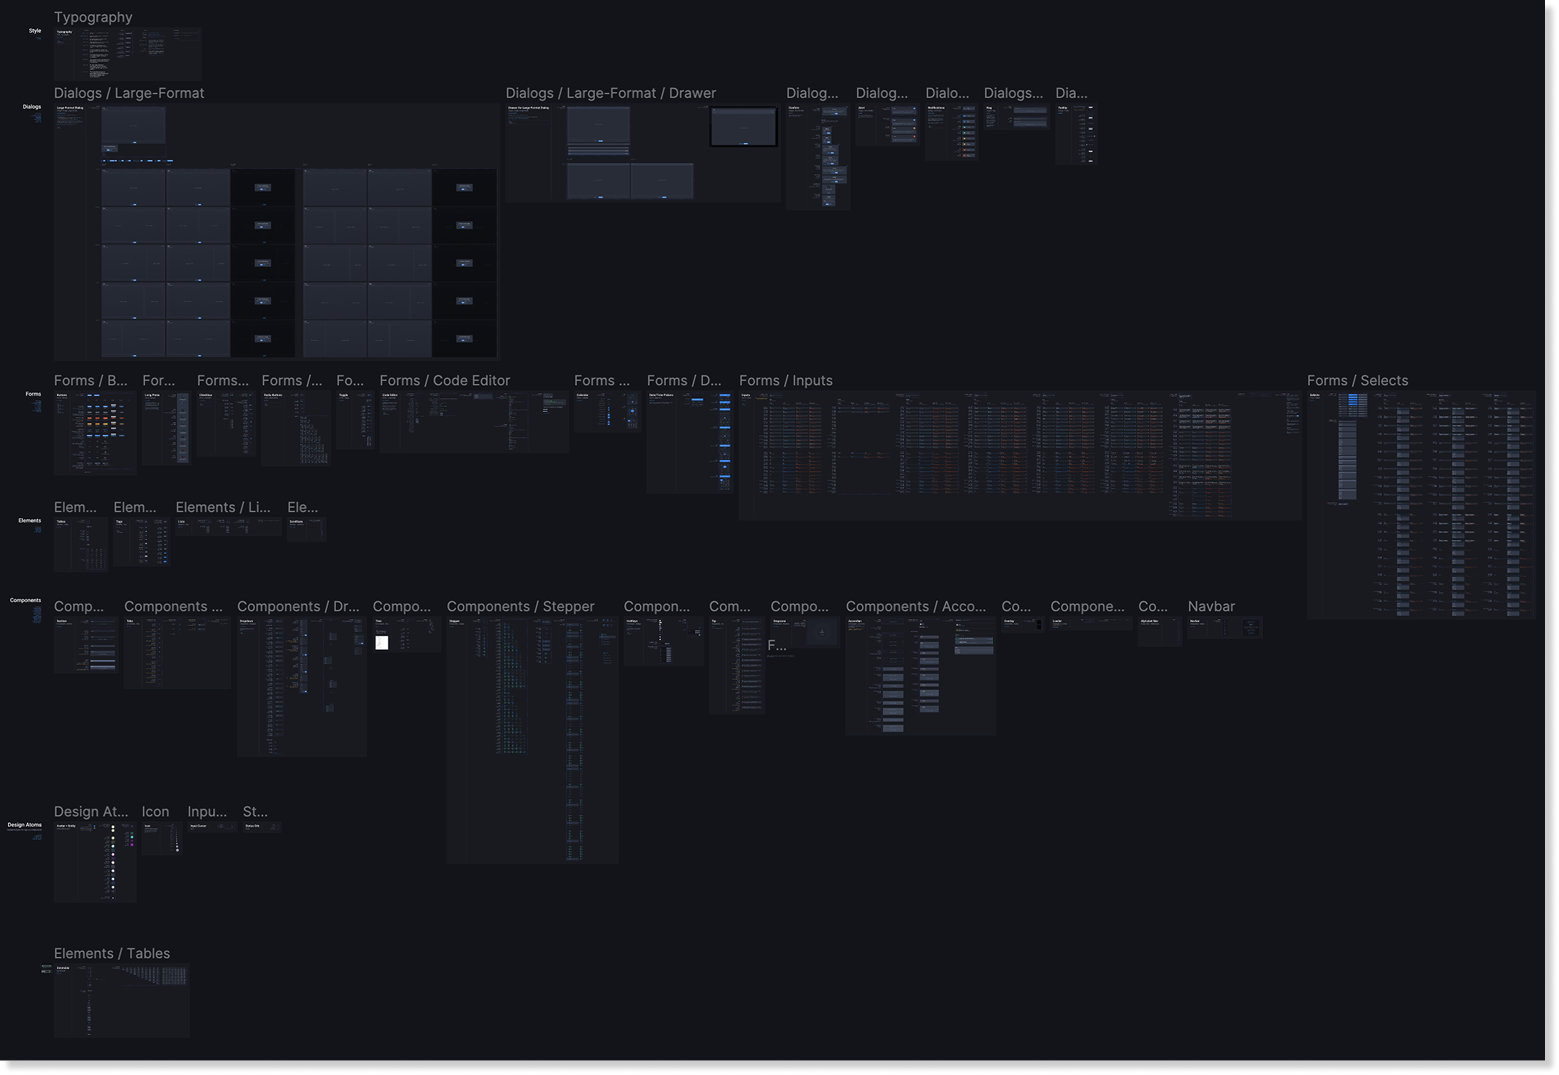
Alongside the platform work: a 100+ component design system built from scratch, and the design partnership model with Product and Engineering that survived three funding rounds. The pre-launch architecture and system foundation became the base forSwimlane Turbine — the agentic AI automation platform launched June 2022 — and its marketplace ecosystem of integrations, playbooks, and AI agents.
05Results
06Key learning
"A dashboard that doesn't connect to action is a screensaver. Design for the decision, not the data — and when the machine acts, design for the human who answers for it."
Agent UX isn't new. It's automation trust with better marketing. The teams designing agent products in 2026 need exactly what six years of SOAR taught: delegation is earned in the interface — through visibility, graduated autonomy, and a human gate that's fast enough that nobody routes around it.